

My Favorite Meeting: The Weekly Metrics Review
My Favorite Meeting: The Weekly Metrics Review
How to actually be data-driven.

This post is sponsored by Enterpret.
Enterpret collects all of your product feedback — support tickets, sales calls, social media, and surveys — and turns it into insights you can act on.
→ Learn how Canva uses Enterpret to build products for over 170 million users, here:
“We want to be data-driven!”
I hear this statement all the time, both from my advisory clients and in my full-time roles.
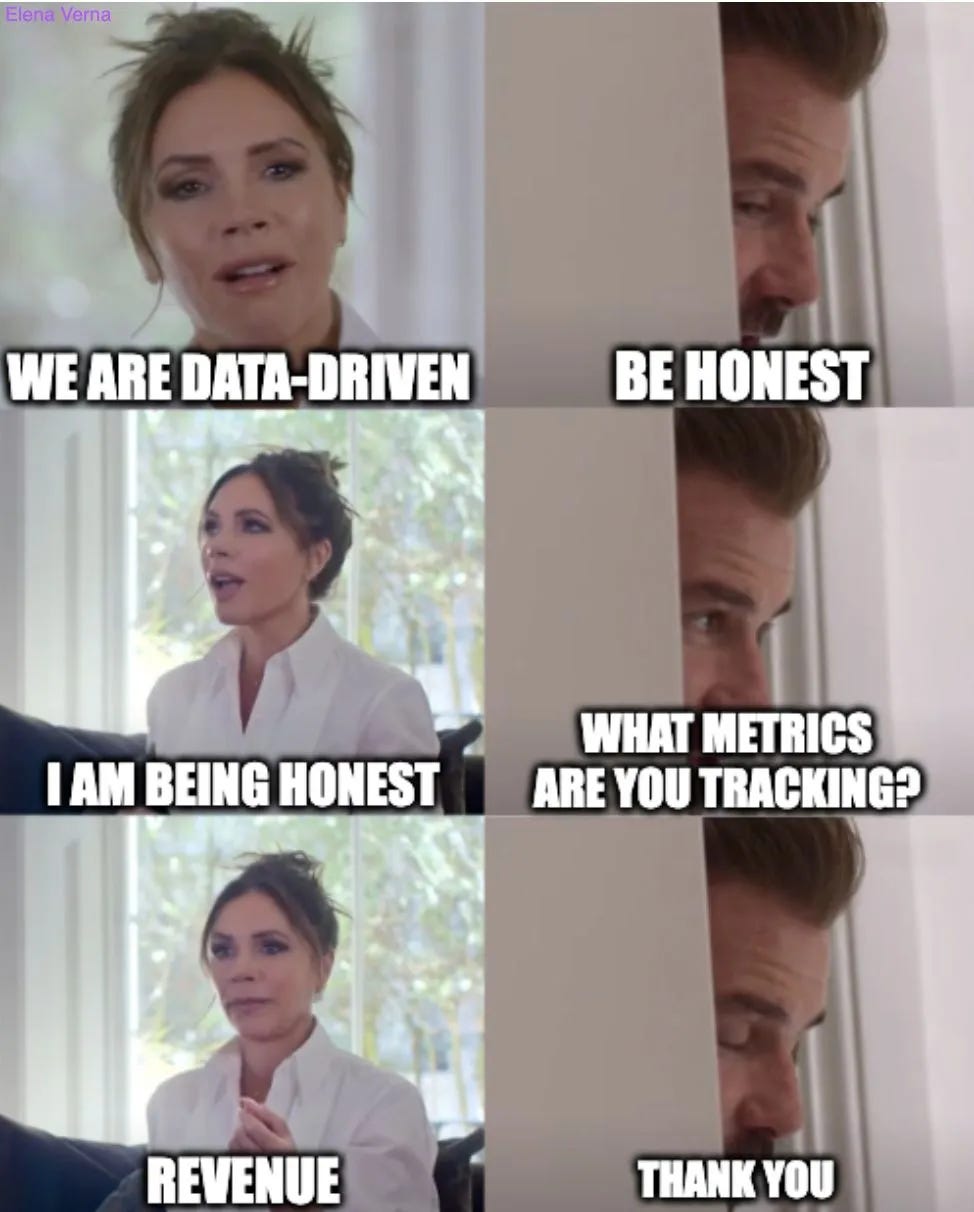
There are several right ways to do this… and one very wrong way, best explained by the one and only Beckham meme:
Want to get on the right track? Here’s my #1 recommendation: Start Weekly Metrics Review meeting.
I’ve seen the transformative effect this ritual has had on my teams at SurveyMonkey, Miro, Amplitude, and now at Dropbox: everyone is on the same page and tracking the same metrics. No more data drift. No more misalignment. No more distrust in data. This one meeting allows the team to focus on executing in the same direction.
Now, I’m going to share the basics of how this meeting works, examples from my previous companies, plus some of the biggest mistakes you’ll need to avoid.
The Basics - How to set up your Weekly Metrics Review
In order for this to work, let’s talk about the What, Who, and When of this meeting.
Here’s the short version. This meeting reviews cover:
(a) All of the driver metrics that lead to revenue,
(b) voiced over by the key individuals that own them (DRIs),
(c) on a weekly basis.
What: The Driver Metrics
First things, first: In order to do any of this, there is a huge prerequisite—You need to identify the driver metrics (aka ‘input metrics’) that can be used to output revenue. I’ll say that again: Revenue is a part of the equation, but it’s an output.
Examples of the driver metrics for self-serve: Prospecting visitors, sign-ups, activation, free-to-paid conversion, ARPA, churn by term, expansion, resurrection. Additional cuts often include geo breakdown, channel attribution, payback period on paid marketing spend, conversion timing windows, voluntary vs. involuntary churn, etc.
Examples of the driver metrics for sales: Prospecting visitors, lead submissions, MQL, SQL, S2, Pipeline, Pipeline conversion, productivity per sales rep, closed won, ASP, renewal, NDR. Additional cuts often include geo breakdown, channel attribution, etc.
Fully modeling all of this out can result in 1000+ metrics… Oprah knows it.

So, how do you decide which metrics are important enough to track on a weekly basis? By knowing which metrics have the assumptions against them.
Revenue scenarios
All companies have revenue goals. But before you get married to some shiny ARR number, it’s important to understand your momentum scenario: If we don’t do anything, what will happen? “Doing nothing” never really happens, but it’s important to have this point of reference, to see what happens with no input. In fact, most companies do momentum deterioration every single year, because they know it's going to decline 10–15% just naturally. This means we have three scenarios:
Momentum: What happens if we do nothing (gradually going down)
Baseline: What happens if we put in the work to prevent natural deterioration (win back that 10-15% natural deterioration)
Lift: Where you want to end up
Both the baseline and lift scenarios have metrics assumptions behind them. For example, if you’re forecasting revenue lift, you should list the specific assumptions for driver metrics—Is churn going down? Is acquisition going up? Understanding this will force you to prioritize.
Metrics behind the baseline and lift scenario assumptions are the driver metrics you’ll want to cover in the Weekly Metrics Review. As a rule of thumb, I also always review basic growth drivers across acquisition, activation, monetization, and retention metrics to ensure we don’t miss any unexpected deterioration. I recommend looking at anywhere from 10-50 driver metrics, depending on the size of your team.
From there, every single initiative that you work on has to be tagged with one of the driver metrics! Even if it's not immediately impacting the metric, each initiative should at least be able to indicate where the expected impact will be, eventually.
Here’s an example: At Dropbox, we have an initiative to make it as easy as possible for users to add content to their Dropbox. “Content Addition” is not a driver metric, it’s a KPI. But you know what are driver metrics? Activation and free-to-paid conversion rate. By adding content, you’re one step closer to activation (it’s the activation’s set-up moment) and more likely to hit your freemium storage limit (2GB). The more content you add, the more likely you will hit your quota limit and the more likely you will be to convert, which improves our free-to-paid conversion rate. So, the intermediate KPI is content addition, set-up rate, and over quota, which leads to activation and free-to-paid conversion - driver metrics.
Who: DRIs
This meeting pulls together all of the Directly Responsible Individuals (DRIs) who are actually accountable for driving the key metrics.
(A major caveat here: Being the DRI does not mean you are the only one accountable to drive that number. More on this, later.)
One more thing I’ll mention: DRIs should not all be from the Growth team. They should be across your entire organization. In fact, DRIs can switch from quarter to quarter or year to year depending on the current focus and how metrics needs to be impacted. The DRI role can even switch departments—for example, from product to marketing, especially on metrics like acquisition—depending on where more work needs to be done.
What makes a good DRI? Here are a few things I think about:
High agency. Ideally, this is someone who is empowered to have ownership over the driver metric and the related elements of the business. This is not the time for tight swim lanes and “This surface is my role & responsibility and the rest is not my problem.”
Ecosystem understanding. This person needs to understand how their metric fits into the whole ecosystem. (Ex. If acquisition goes up, for instance, whoever is responsible for activations must realize that any spike in acquisition will likely send a hard drop toward activation. That’s a very simple example, but this individual has to understand what’s happening and how each other metric is affecting the overall solution.)
Contextual history of the metric: What’s worked in the past? What hasn’t? This requires actually digging in and doing the homework.
Extreme growth mindset: This one is particularly hard. Yes, it would be nice if your metric always went up and up and up… but usually, it’s more like nothing, nothing, nothing down, nothing, nothing, maybe up. So, the DRI has to understand: Why was it nothing? Why was it down? Why was it nothing again? You have to be willing to lean into failure and figure out where the growth—or lack thereof—is coming from.
Ability to program manage: Given that this role is essentially program-managing everything around this metric, it’s crucial to be able to keep a lot of pieces moving at the same time.
I’ll also add that Finance and Analytics both must be a part of this:
Finance: This is (hopefully) obvious, but given the financial focus of this ritual, the finance team needs to be involved, to be on top of what’s happening.
Analytics: When I was at SurveyMonkey, I led this meeting as a sort of neutral third party. I was a sort of ‘Switzerland’ in this scenario, presenting the data objectively, without any confirmation bias or trying to explain it in a weird way. However, this is not that common: Generally, the actual business owners will be the ones talking, so the person explaining the metric is the one who is most directly involved with it.
When: Fast, Weekly Cycles
When should this meeting happen? As soon as you have over 100 users. Okay, that’s probably not what you meant, but seriously: Start this ritual early.
The other important factor to remember: This is a weekly meeting. Forming a habit around it is essential—you must avoid falling into the dreaded forgettable zone at all costs. Metrics should become part of people’s everyday conversation, and lots of repetition is needed to get there.
I recommend that you schedule on Tuesdays, as this gives everyone Monday to debug what happened in the previous week and have most of the answers ready for the live meeting (avoiding lengthy follow-ups).
Given the frequency of this cadence, information must be clarified quickly. For instance, if I don’t have an answer during the meeting, I have 24 hours (48, max) to bring the answer back to the group. This type of super quick cycle helps everyone to swarm and figure it out.
Mistakes to Avoid
Now that you’ve got the general framework, here are a few of the biggest mistakes that I see teams consistently make:
Mistake #1 - Choosing (and Sticking to) the Wrong Metric
As I’ve already mentioned, the biggest issue is only looking at revenue, or just choosing a bunch of KPI metrics that haven’t been tied back to revenue.
You can see this when a KPI goes up… and there’s no impact on revenue. Hold your celebration and diagnose whether:
There is lag time to revenue, but you can see impact cascading further down the funnel. For example: You crushed acquisition, but is that translating to a lift in activation and monetization?
You understand where you’ve created the next big drop-off (lifted acquisition, but new sign-ups are not activating), and are quickly pivoting to attack the next metric.
You have identified a metric that has a correlative (but not causal) link to revenue, which means more learning is required and the metric should not be a driver metric.
You have discovered a vanity metric that requires a clearer definition (The classic one here is Weekly Active Users: If you define it as ‘Logged in within last 7-days,’ it is likely a vanity metric. Now, ‘Performed a meaningful action 3 out of the last 4 weeks’... that’s a true predictor of retention and revenue!)
Yes, it’s inevitable that you won’t get all the metrics in your model right the first time. But if you don’t change them when you realize they don’t actually move the revenue needle, that’s on you.
Mistake #2 - Blaming the DRI!
Do not treat a metric’s DRI as the only responsible party for that metric. The DRI role is more about being the coordinator who is supposed to pull the resources together to impact that number. You could think of them as being the ‘Metric CEO,’ so to speak.
Here’s how to avoid falling into this trap:
Prioritize DRI support: You have to clearly articulate to the organization: If a DRI for one of the driver metrics comes to you with a request, you have to prioritize it. You can’t just say, “No.” Or, if you’re saying “No,” it’s going to be a point of escalation—obviously, you can’t say “Yes” to everything and there may be other priorities, but the DRI does take priority.
Set DRIs up for long-term success: By their nature, DRIs are going to be mostly focused on short-term outcomes, because all of these metrics are very much within the quarter, within the year. They’re not long-term investments. Sometimes you actually do want to do something at the expense of the short-term, to invest in the long term. So there needs to be a natural tension there, which cannot just be ignored. To make sure the DRI doesn’t get trapped in a short-term loop, set an explicit expectation: for example, say that 25% of our resources will be dedicated to creating long-term sustainability and growth.
Enable the DRI to manage the roadmap for the metric across teams. There must be some sort of mechanism for roadmap management that is tagged against the driver metrics, so you can pull it up across the entire product and marketing organization and see what work is happening to affect that item. The DRI needs to be able to tell if they will actually see the lift, or even just get to baseline, or if they’re just doomed to be at the momentum level. In the end, there have to be systems and processes to be able to aggregate this.
Provide a clear channel of escalation. If your DRIs don’t feel like initiatives are landing at the right place at the right time, they need to be able to address that. This can be a general organizational challenge but needs to be addressed.
Include DRIs in re-forecasting every single quarter. Most companies re-forecast every quarter, maybe every six months—after setting the budget for the year, they look at things along the way: how are things going and does my forecast need to change? Whenever these conversations happen, the DRIs have to be present—both to provide the relevant information, but also to allow them to be more in charge of their destiny. Or, at least, to know how much of their destiny is going to be out of reach and which stakeholders they’ll need to pull on.
We actually just went through this with the team here at Dropbox, as I got more than one slightly terrified slack from DRIs, afraid that they would be held accountable for a massive organizational metric. But once we aligned that they simply had to coordinate it, everyone quickly got on board.
Mistake #3 - Making this Process Too Manual
This one is simple, but often becomes a problem: These metrics should be pulled automatically. Perhaps a few rounds of manual gathering can be helpful when the team is just getting started, but since this pull is extremely repetitive, you should operationalize a dashboard that can grab it automatically.
This allows everyone to focus on what really matters: Reviewing the metrics and the complete picture that they present, together.
Mistake #4 - Not Having Leadership Buy-in
If your executive team is not interested in being data-driven, you won’t succeed with any of this. Your execs, VP, and leadership should not only be present and engaged in this meeting, but preferably even present at the beginning to set the tone.
Conclusion - So what?
So, you want to be data-driven… but does this really matter?
Yes, it sure does.
Without this kind of practice, companies almost always fall into the perception-reality gap: Company leaders continue to make decisions based on their intuition about what’s right, but never course correct, because they’re detached from the on-the-ground data that shows things going wrong. Or, even if the leaders’ intuitions are correct, the organization is unable to scale these instincts and the organization overall is unable to execute.
Ultimately, inconsistent definitions and misaligned expectations lead great teams to move quickly… in different directions. And repeat the same mistakes over and over again. Even with the best possible strategy, your organization needs a shared measurement point to align around.
The Weekly Metrics Review meeting is that reference point!
Edited with the help of Jonathan Yagel—check out his awesome Substack.
100% this. The most direct path to effective, aligned decision and adaptation is a shared understanding of what is happening and why. A causal model of the business.
Metrics are the building blocks for that model!
For those interested in diving deeper. See metrics trees and the work Levers Labs and us at Sightfull are doing on this :)
Looking forward to hearing more about how you choose and act on metrics!
100% agree about the need for the need for data-driven operations with a regular KPI cadence beyond simple financial metrics.
At SQOR.ai we provide all of your KPI’s directly monitored from SaaS tools data and aggregated from every division on one master platform (causal model applied automatically with regular alerts) and we make it possible without the need for any data scientists at all. And it’s daily, so DRI’s can act quickly as trends and alerts happen.
Here’s a wonky demo: https://youtu.be/z3dnbYPLOEk?si=zll1gWCPhtfJV3Y1